Decoding the Financial Health of Richmond Hill isn’t intended as a “gotcha,” nor is it meant to assign blame or make city staff or elected officials feel guilty. Rather, they are an invitation to look carefully and honestly at what the numbers are telling us.
The fiscal health of our cities isn’t shaped by a single budget or council vote—it’s the result of decades of decisions, policies, and development patterns. Across North America, Strong Towns advocates are using the Finance Decoder, a toolkit created by Strong Towns, to better understand their communities’ fiscal trajectories. Strong Towns Richmond Hill used this toolkit to analyze our city’s finances. So far, we’ve only been able to access financial statements dating back to 2017. City officials in the Financial Reporting and Accounting department told us they do not retain statements beyond seven years. We are exploring other ways to access older records and will add those results to this report to make it more comprehensive. What follows is an initial look at Richmond Hill’s financial story—based on the charts and indicators we can analyze today.
Why Financial Health Is About Patterns, Not Headlines
Municipal budgets often grab attention for what they promise in the next year: tax rates, capital projects, or service changes. But long-term fiscal health is revealed by patterns—how revenues grow relative to costs, how much infrastructure a city must maintain, and whether today’s development pays for tomorrow’s obligations.
The Finance Decoder focuses on these patterns. Rather than judging individual policy choices, it asks a more fundamental question: Is the city’s overall financial trajectory sustainable?
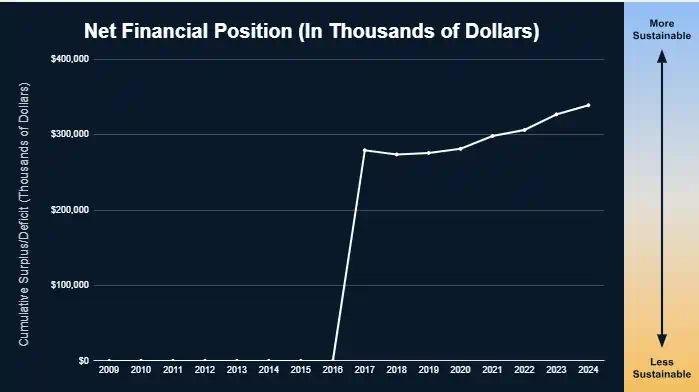
Financial Position
What it is:
The difference between the city’s financial assets (like cash and receivables) and its liabilities (like debt and pensions). This is the cumulative surplus/deficit that the city has accumulated through successive budget cycles.
What it tells you:
A positive net financial position suggests the city has more financial assets than obligations and is in a better position to weather downturns, invest in infrastructure, or respond to emergencies without resorting to borrowing or service cuts.
What the trend shows:
An upward trend means it’s becoming more financially secure.
So far, it’s been a good start for Richmond Hill. Let’s see what kind of storythe rest of the charts tell us.
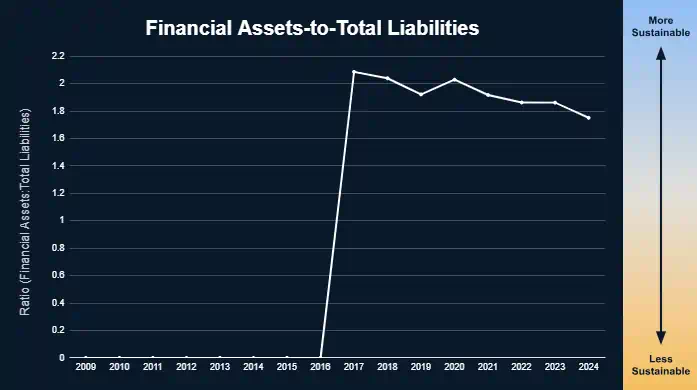
Assets to Liabilities
What it is:
The city’s financial assets—such as cash, receivables, and other short-term holdings—divided by its total liabilities. This is a different way of presenting the Net Financial Position.
What it tells you:
This ratio shows whether the city has enough liquid financial resources to cover what it owes. A ratio below 1 means it would not be able to pay off its liabilities using only its financial assets, which is a sign of financial stress.
What the trend shows:
A falling trend suggests the city is becoming less able to handle its obligations without borrowing or cutting services.
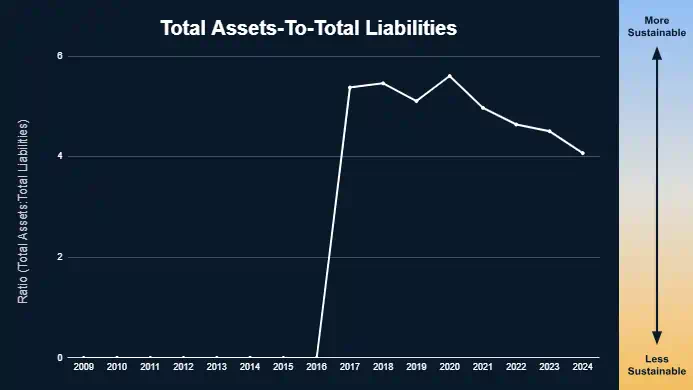
What it is:
The value of all the city’s assets (including infrastructure) divided by its total liabilities.
What it tells you:
A ratio above 1 means the city owns more than it owes (solvent). Below 1 means it owes more than it owns (insolvent).
What the trend shows:
A downward trend means the city is becoming less solvent.
Debt
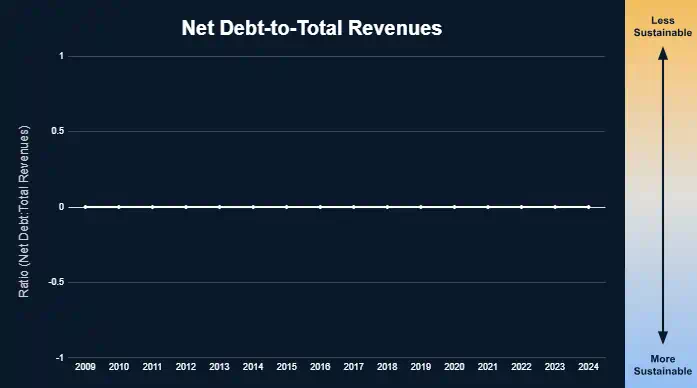
What it is:
The total liabilities the city owes compared to how much revenue it collects in a year. As you can see above, this graph shows a flat line at 0. This means that Richmond Hill has a net surplus (no net debt).
Depreciation
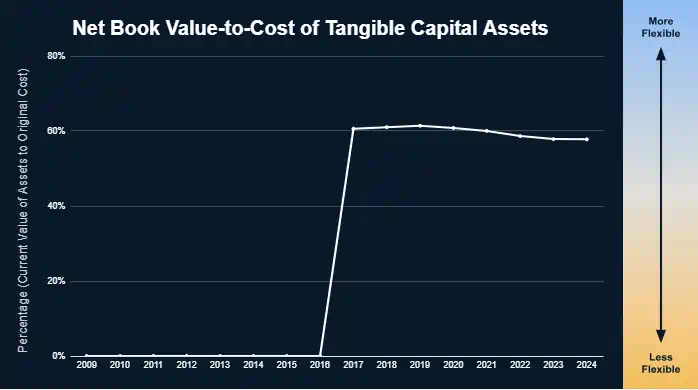
What it is:
The current value of the city’s physical assets compared to their original cost.
What it tells you:
This indicates how well the city is maintaining its infrastructure. A low value means assets are aging and wearing out.
What the trend shows:
A declining trend means the city is falling behind on maintenance.
Grants
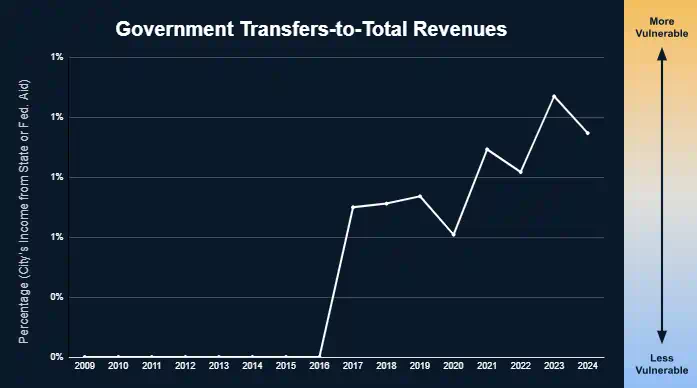
What it is:
The share of the city’s income that comes from state or federal aid.
What it tells you:
High dependency on outside funding makes the city vulnerable to political or economic shifts beyond its control. When a city becomes overly dependent on federal or provincial grants, it may appear financially supported in the short term, but it also becomes more vulnerable in the long run—both fiscally and politically. Grant funding is often temporary, conditional, and tied to priorities set by higher levels of government, not by local needs. This can push municipalities to shape projects and policies around available funding rather than around what is most effective or sustainable for their community. Over time, reliance on external money can weaken a city’s own revenue base, create uncertainty when programs end or governments change, and limit local flexibility. Perhaps most importantly, it can erode municipal autonomy, shifting real decision-making power away from local councils and residents toward distant governments, leaving cities less resilient, less accountable, and less in control of their own future.
What the trend shows:
If the trend is rising, the city is becoming more dependent on outside help.
Conclusion
This article and the accompanying graphs are not intended as a “gotcha,” nor are they meant to assign blame or make city staff or elected officials feel guilty. Rather, they are an invitation to look carefully and honestly at what the numbers are telling us. Financial data, when viewed over time, can reveal whether our choices are responsible or whether they quietly create liabilities that future residents will struggle to pay for. Used thoughtfully, these numbers help us move beyond short-term debates and toward a shared understanding of risk, resilience, and stewardship. If we want a financially strong Richmond Hill, we need to be willing to learn from the data—especially when it challenges our assumptions—and use it to make wiser, more sustainable decisions for the future.